25
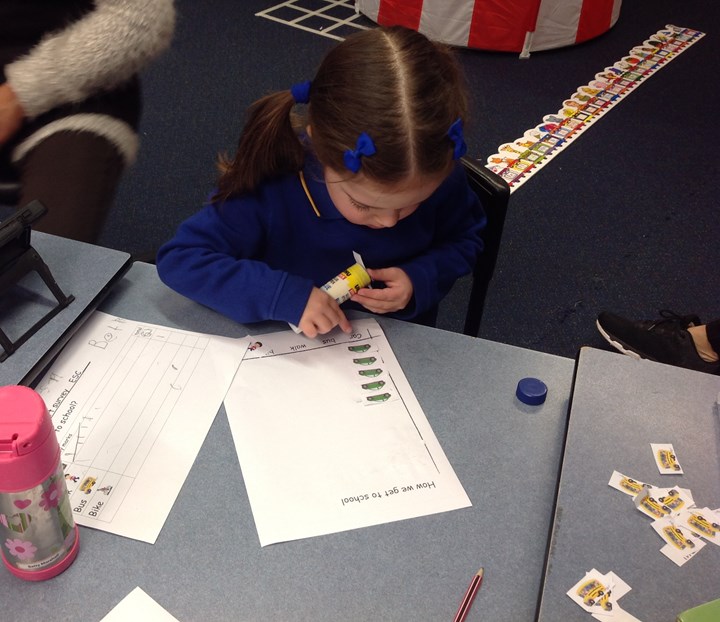
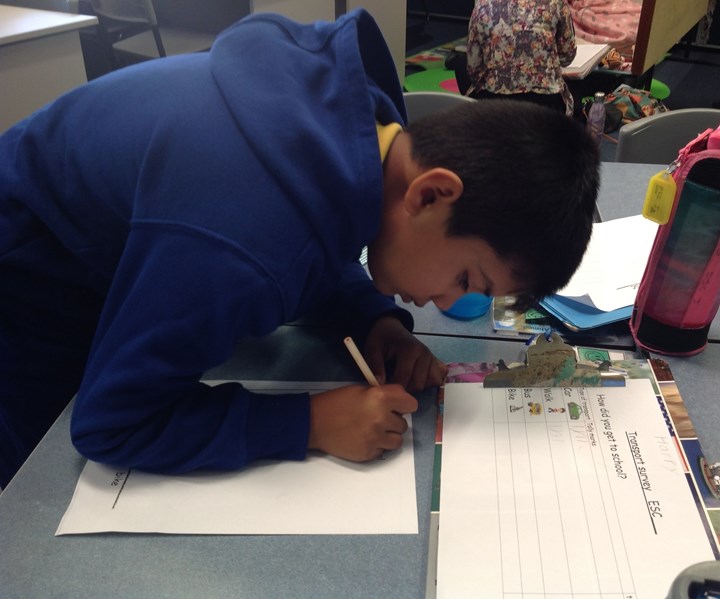
This year's hands up survey provided a great opportunity to use real life data for Maths Data representation and interpretation lessons. The students enjoyed creating meaningful graphs to display the results of our 'How we get to school' survey.
Discuss this story
1 Comments
Please login to comment
James (Your Move)
Hi Claire - lovely to see you back online in 2019! Uploading your results to our online tool will give you 20 points automatically (or already has perhaps!). I have also given you 15 points for using the opportunity to run a maths activity based on the survey. Judging by the photos, it looks like it was a great way to really get the kids focused. Make sure you let us know about any other Your Move activities you have been up or have planned. See you soon!
Report comment