124
No better time to do these lessons than Bike Month. At the end of last term, I printed out some of the SDERA lessons for each year level and wrote a cover letter asking teachers to try and fit in a lesson or two during Bike Month. Specialist didn't miss out and I even found some songs for the Music Teacher. I also mentioned it at staff meetings and sent a follow up email. I was not disappointed! Some classes stuck to the SDERA and others branched off. But it was a great result from all.
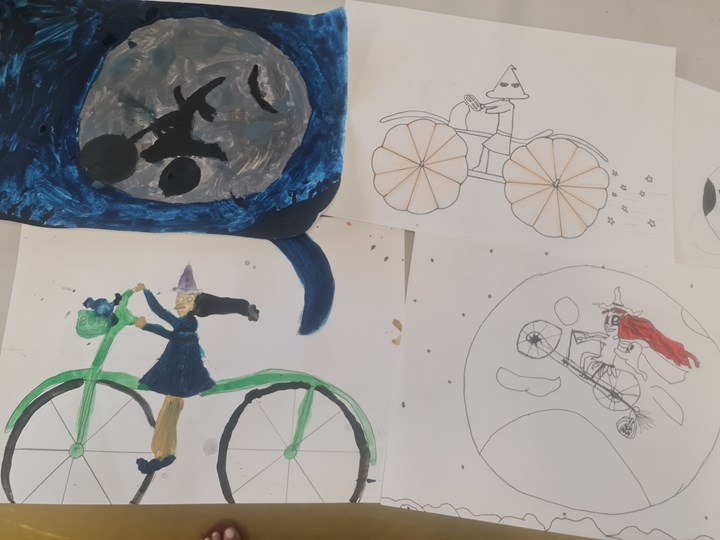
To combine Bike Month and Halloween in Art, the Year 3/4 students from Room 9 have drawn witches with a different transportation rather than a broom!
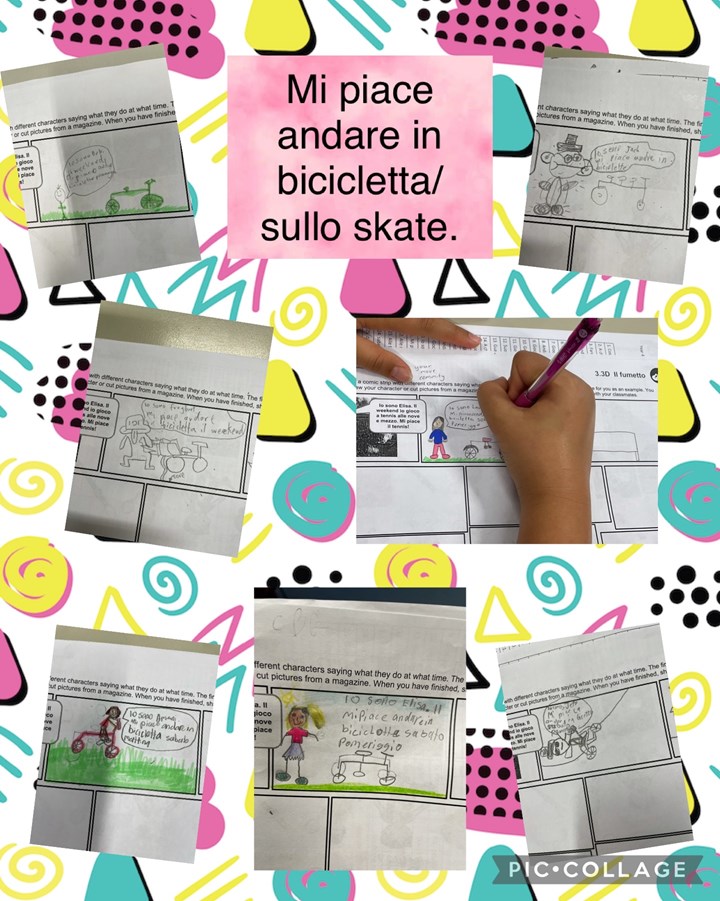
This term in Italian, Room 9 and 10 have been learning about past times and activities that they can do on the weekend as well as how they get to school daily. We have learnt the words for bike and scooter as well as learnt how to say “I like to ride my bike/scooter” in Italian.
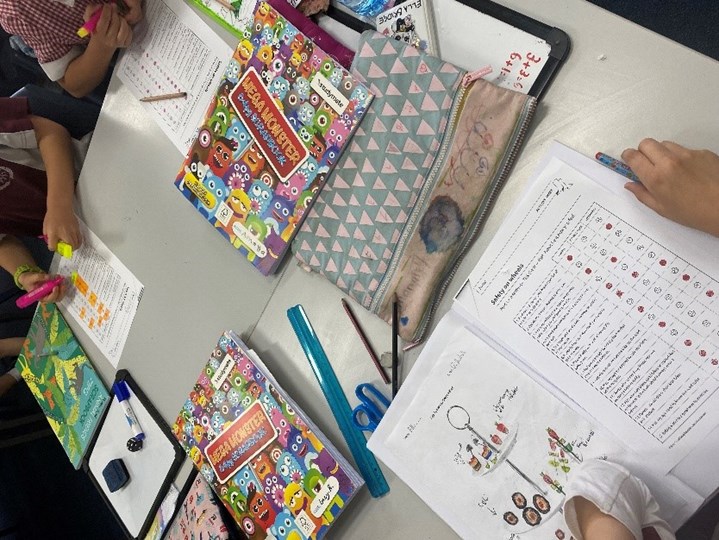
In Room 4, we have been learning about surveys and data. Specifically, collecting and displaying data so it was a perfect time to introduce a bar graph related to Bike month. Students described the different ways they travelled to school that day and recorded their responses on the graph. We discussed how bar graphs are made and what they are used for and began to make inferences from the graph. We inferred from our graph that driving in the car was the most popular way to get to school and that riding a bike or scooter was the least popular way to get to school in Pre-primary.
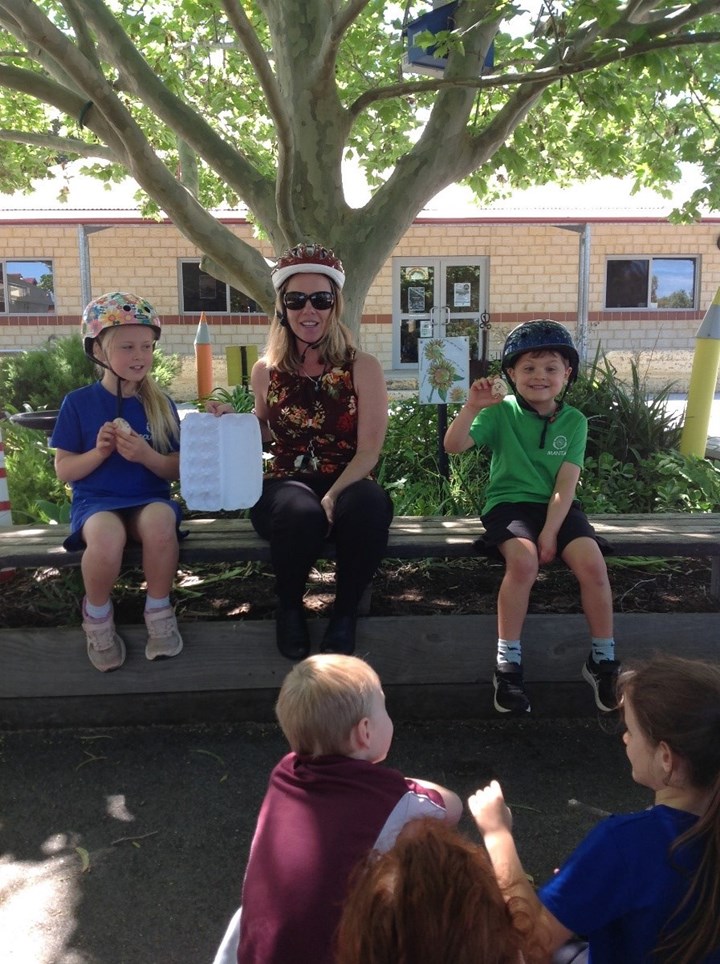
Room 5 talked about the similarities between our head and brain and that of an egg. We recited and talked about Humpty Dumpty and how he could protect his head if he had an accident. We went outside and experimented with two cooked eggs dropping one without protection and one in the egg carton. Unfortunately, they both broke so we discussed how we could improve the egg carton so that it would protect the egg and looked at the extra padding in our own helmets.
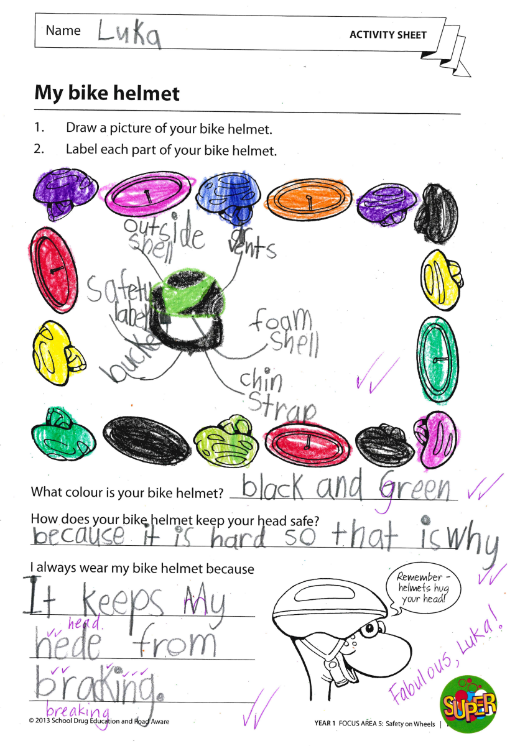
In Room 13, we learned about the importance of wearing bicycle helmets to protect our heads when riding our bikes. We met Humpty Dumpty and his cousin, Humpty Doo. Humpty Dumpty chose not to wear a helmet when riding his bike, so he cracked his skull when he had a great fall! Humpty Doo did wear a helmet and his head was protected when he fell. Smart choice!
The children from Room 1 conducted a lesson on bike helmet safety. They went through a process of rubbing an orange along a bitumen path to see what could happen to their facial skin if they were not wearing a helmet. We then discussed how an egg had a shell that protected the egg’s inside. This was then compared to our skull and how the skull protected the brain. We then conducted an experiment to see what would happen to an egg if dropped from various heights. The children then designed a helmet that would protect their egg. It was a really good example of why it’s important to wear a bike helmet.
For Bike Month in Room 2, we discussed the importance of safety when riding a bike. We talked about different stages of skill the children progress through when learning to ride and how to keep themselves safe throughout these phases. The students had an opportunity to engage with their peers to hear other points of view, as well as reflect on their personal knowledge and understanding through a circle talk and Safety on Wheels questionnaire.
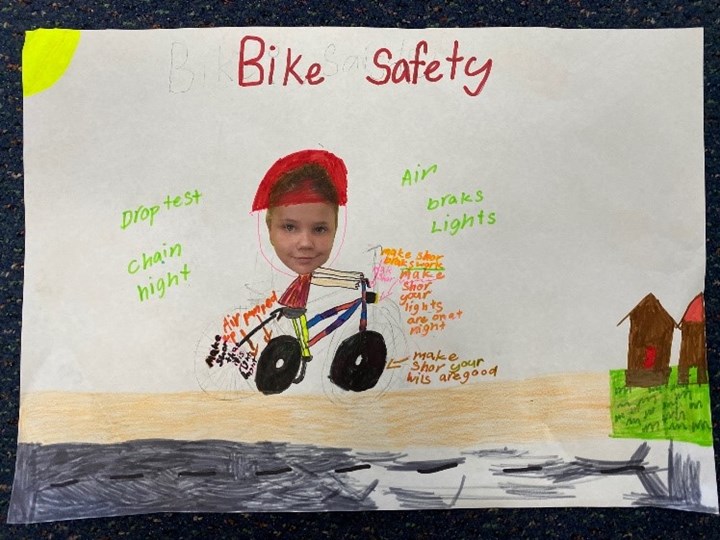
In Room 3, we started with a brainstorm of some things we already knew about bike safety. We then viewed “Way2go Bike Check” on YouTube. After that, we read some information about bike safety and highlighted the parts we thought were very important. With the information we had learned from the “Way2go Bike Check” video and the Bike Safety written information sheet, we then created our own Bike Safety Posters. First step was learning how to draw a bike. Once we had drawn our bikes, we added ourselves sitting on the bikes! Finally, we added in all of our Bike Safety facts and then decorated our posters.
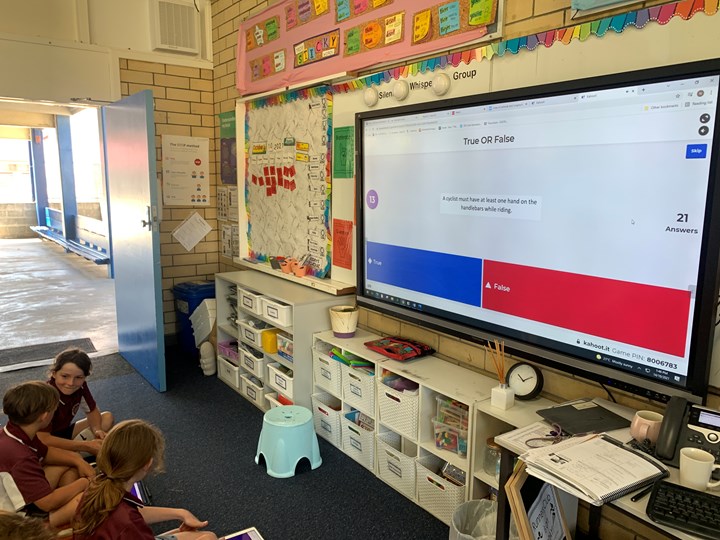
In Room 9, we celebrated Bike Month by completing a cycling quiz on Kahoot. We then discussed each of the answers and shared our experiences when riding bikes around the neighbourhood!
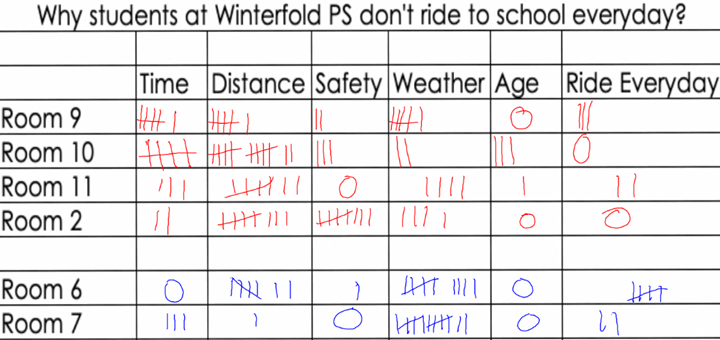
Room 10 have been learning about collecting and recording data. Students wanted to find out why students at Winterfold Primary School were not riding their bikes to school every day. The students came up with options as to why students can’t ride to school. They then had to write the hypothesis into a question. The question was Out of time, safety, age, distance and weather which is the reason you can’t ride to school every day? They then surveyed some other classes. From the data that was collected safety was an issue for students that are in Years 3 and 4 more than the students that are in Years 5 and 6. The students noticed that distance from Winterfold Primary School was one of the biggest reasons students don’t ride to school.
Students in Room 11 have been participating in cooperative learning groups about making cycling and riding decisions. They completed a place mat activity to record and share real experiences and emotions after being encouraged to act in an unsafe way. The groups then used a decision-making model with an allocated scenario to consider the choices they had and the decisions they could make, using different strategies including assertive responses, for a positive outcome. The students shared their scenarios, choices and decisions with the class. Overall, my students are more confident in their understanding that they do have choices and that the right decision could prevent serious injury or loss of life.
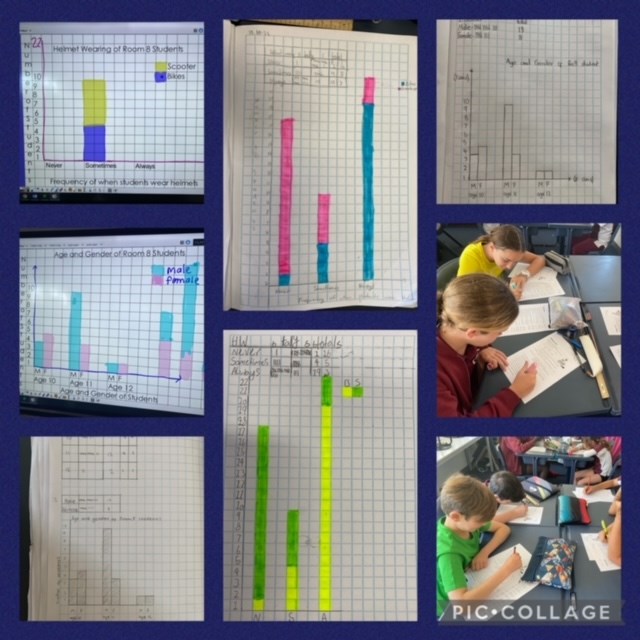
In Room 8 we recorded how many bikes and scooters were at school every day through Bike Month. We used this data to create stacked and side by side graphs. We then analysed this data for anomalies. For example, on Day 3 the number of bikes and scooters rose as on Day 2 we put up posters and advertised Bike Month. Day 7 numbers were down a lot as it was raining. Guess which day we held our Dress Up Your Bike Competition? We also completed the SDERA Riding Survey and used that data to create various graphs. This aligned perfectly with the Year 5/6 Maths curriculum.
This story is related to Promote Road Safety with SDERA - Term 4
For more information on how to do this, click hereDiscuss this story
2 Comments
Please login to comment
Julia
oops .. I forgot to add the picture of the Bike Month graph. Nevermind, it was in a previous story.
Report comment