32
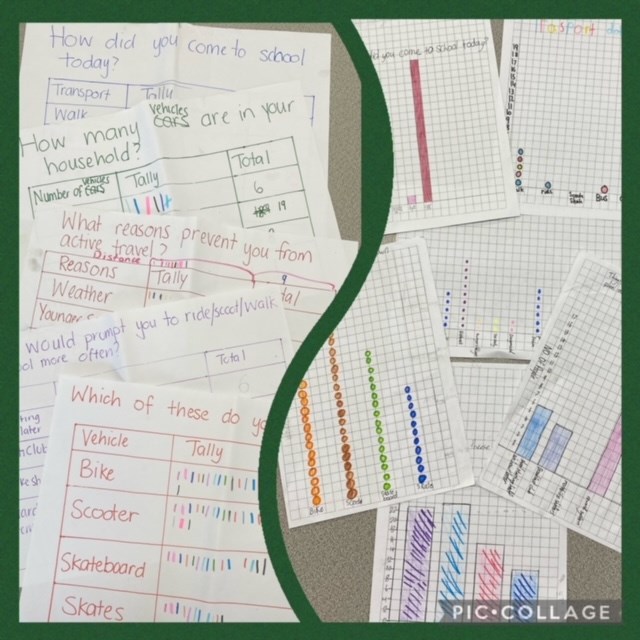
In Maths we have been looking at data collection and representation. And in my class, that means a Your Move opportunity. We brainstormed YM questions we could ask and created tables that we placed around the class. Students then walked around and answered each question by putting tally marks in the table (we have to do some work on how to properly do tally marks). Finally, they used this data to create picture graphs, dot plots and column graphs. This gave us some interesting information about our class and possibly some avenues for our Your Move team to explore.
This story is related to Create Your Own Classroom Activity (10)
Discuss this story
1 Comments
Please login to comment
James (Your Move)
I'm glad to hear that Your Move is at the forefront of your mind when lesson planning Julia 😊. You have earned 15 points for basing your data collection/representation lesson around Active Travel and another 10 points for clearly explaining how it all worked.
Report comment